Single Family Residential Sales in Kitsap County for the previous 15 Months, Through March 31, 2011

Previous 15 Months Single Family Residential Sales Data for Kitsap County

Note: In the event you got to this article from an older link, here is a link to the newest data for this category of monthly home sales in Kitsap County

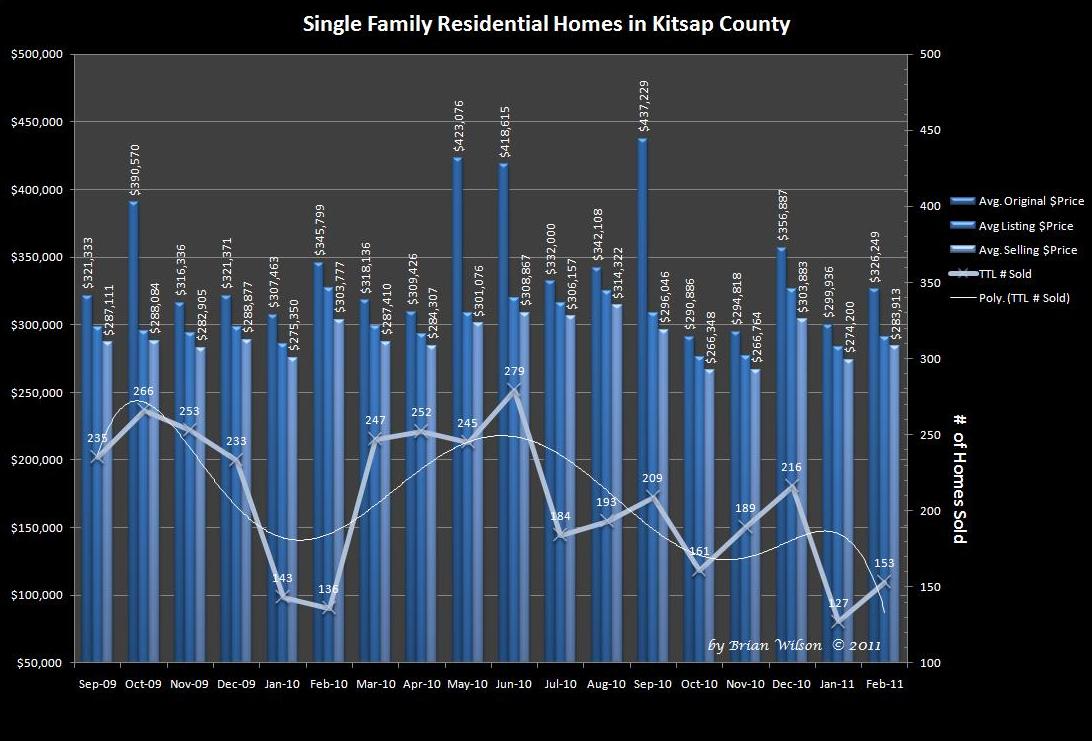
The line graph shows the total number of single family residential homes sold with a smooth trend line overlaid.  The Bar Graphs, show the Average initial asking prices, the Average Price at which an offer was received and then the final Average Selling Price.

The good news is that the number of Homes Sold this March showed a significant increase from the previous 2 months, but were still 12% below the sales from March 2010.

Posted in Kitsap County Real Estate Data | Tagged , | 1 Comment

Washington State Real Estate Data

State-wide Data For 2010

Existing Home Sales in WA = 84,890 up 0.1% from 2009

Decline in Existing Home Sales(units) since peak in 2005 = 46.8%

Median Existing Home Sales Price = $250,400, Down 1.6% from 2009

Median Home Price Decline since 2007 Peak = 20.4%

Average Mortgage Rate in 4th Qtr 2010 = 4.62%

Months Supply of homes on market at end of 2010 = 7.6

Mortgages at some stage of foreclosure in late 2010 = 35,300 up from 24,900 in late 2009

All-Buyer housing affordability index in 4th Qtr of 2010 was at an ALL TIME High of 149.4.  The median income family has 49.4% more income then the minimum required to purchase a median priced home…State-wide

Washington home ownership rate in late 2010 = 64.7%, down from 69.2% at the peak in 2005

First-time homebuyers who cite tax advantages as a major reason for buying a home in 2009 = 51.8%, (may reflect govt tax credit)

Source: Washington Realtors®, www.warealtor.org
Posted in Washington State Real Estate Data | Tagged | Leave a comment

Number of distressed Sales compared to total Sales in Kitsap County


Ever wonder what portion of the total single family residential sales in Kitsap County are distressed?
This graph tracks the distressed properties as a portion of the total sales in Kitsap County for the past 18 months.  For this review, distressed properties are counted as either bank owned (REO) or Short Sales (SS).   The percentage of Sold Proerties that are considered “distressed” have been remarkably consistent, averaging about 28% of total sales.
Of this 28% of the market, about 75% are Bank Owned (REO’s), while only 25% are Short Sales.

Posted in Kitsap County Real Estate Data | Tagged | Leave a comment

Here is a revealing chart for Single Family Residential Sales in Kitsap County

Note: In the event you got to this article from an older link, here is a link to the newest data for this category of monthly home sales in Kitsap County

This chart shows monthly sales data for all Single Family Residential Sales in Kitsap County during the past 18 months. I created this chart with data from the NWMLS.  The line graph shows total closed sales for each month, while the curved line is a 6th deg. polynomial smoothing the sales trends.  For the current month of March it appears the numbers are improving from the previous month.

The Avg. Original Price is the inital asking price when properties are first put on the maarket. The Avg. List Price, is the price at which an offer was received, and the Avg. Selling Price is just that.  What this clearly shows, is that initial asking prices are still on average, too high requiring price reductions in order to attract offers.  The differential between the last List price where an offer was received and the Final Selling price is a much tighter range, with that differential being on average about 96.3% of the price at which offers were received.

Posted in Kitsap County Real Estate Data | Tagged , | Leave a comment

Graph for the Amount of Home you can afford as Int Rates Change

There are many ways to look at it, but the end result is the same:  As rates go up, as a Borrower you  qualify to Buy increasingly less home for the same amount of monthly payment.

Posted in Financial Data, Interest Rates & Graphs | Tagged | Leave a comment