
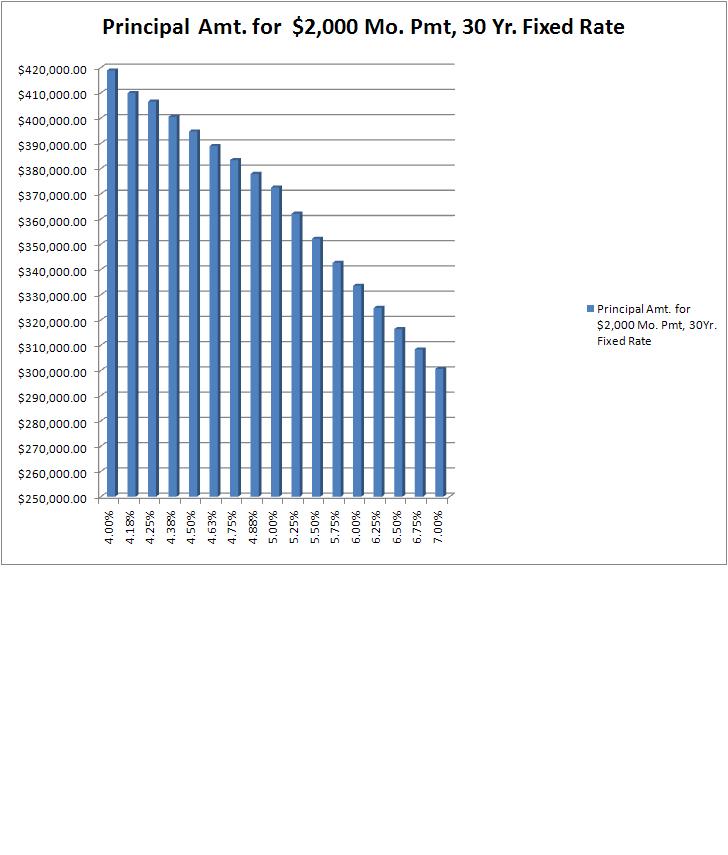
This graph I made for a client, sums it up succinctly. In their case, for a fixed Payment of $2,000/month Principle & Interest, the graph shows how the Loan amount varies for that same fixed payment at various interest rates.
This is why we currently believe that interest rates will soon have a more significant effect on total home cost than waiting for any additional potential price reductions for any given property.