Home Sales Data for Hansville, Kingston, Port Gamble: Jun -Aug 2013

Real Estate Trends in Hansville, Kingston & Port Gamble August 2013 & 18 Mo Prior

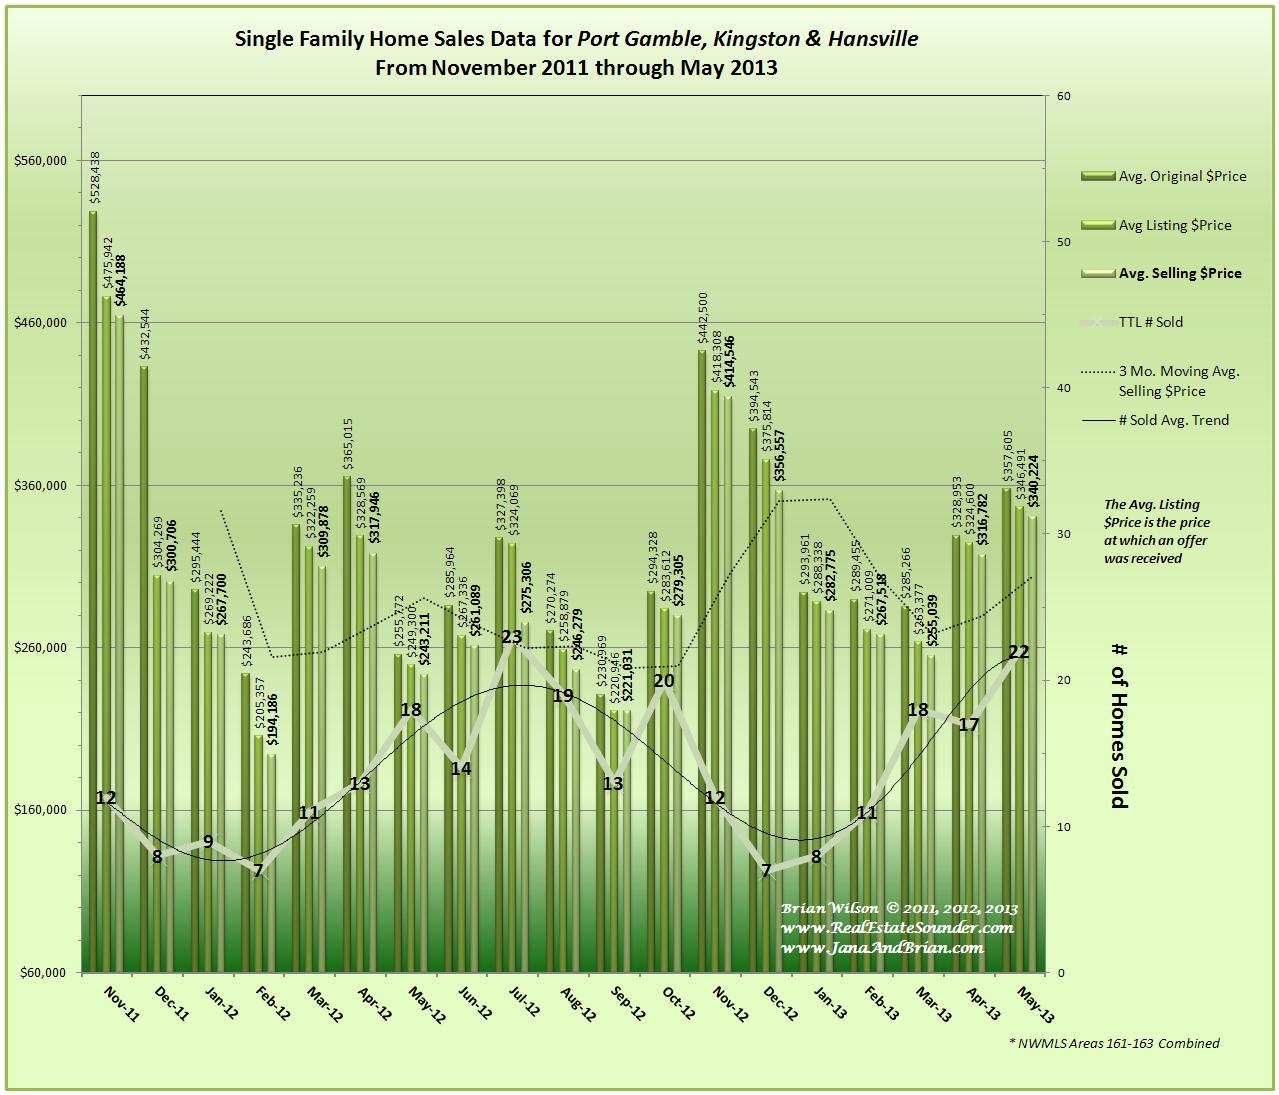
Home Sales & Prices in Kingston, Port Gamble, & Hansville August 2013 including 18 months prior data

Wow! Someone must have given away the secret about this area, and as we predicted in our June Report, home sales and prices have been on fire in this combined market area of Hansville, Kingston and Port Gamble.   Average and median selling prices were significantly above the levels for the same period one year ago and while the number of homes sold in July of 2013 were identical to the number sold in July of 2012, June and August numbers far exceeded the levels for the same months one year ago.

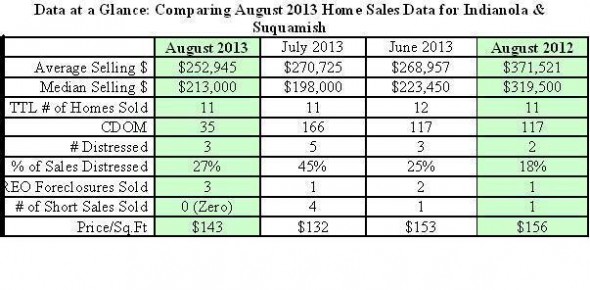
Here’s the monthly data at a glance for the last 3 months and we’ve included the data for August 2012 to help you easily compare the current August 2013 data with the same period one year ago:

Chart of Home Sales & Prices in Hanvsville, Kingston, Port Gamble

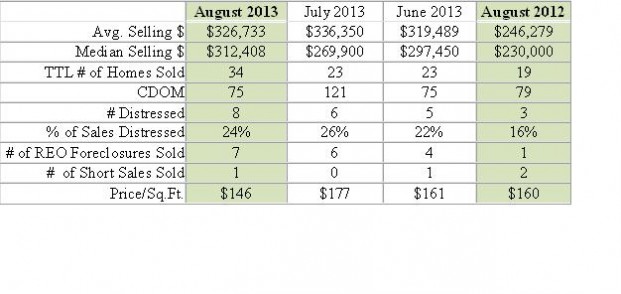
Home Sale & Price Data for Hansville, Kingston & Port Gamble: June – August 2013

The Average Sold home price was up almost 33% from the same period one year ago and  the Median home sales price was up almost 36%!  Impressive, but so is the number of homes sold in August 2013 compared with the same period one year ago: up almost 79!

Here’s a look at the current inventory of Active listings and Pending sales:

There are currently (as of 9/10/13), 104 Active listings which represents only about a 3 month supply (we apologize for an error when we first published this yesterday on 9/10.  We reported this to be a 1.4 month supply of homes, but we slipped a column in our data.  We’ve since verified all of the other data).

This relatively low level of inventory is typically associated with a Seller biased market and is an environment where it would be common to have multiple offers and back up offers for many properties, and it recently happened to one of my clients when their dream home went Sale Pending in only one (1) day and there were two (2) Backup offers.  To be the successful buyer  in this kind of market, you just have to be ready to act quickly as soon as the right home comes on the market and you need to be prepared to make your first offer your best offer.

These Active listings have an average asking price of $435,207  and a Median asking price of $320,450.   The high average price and the large gap between the average and median values is due to a large number of high price properties that are on the market.  Currently there are 9 properties in this area that are near or over a $1 Million asking price with one at $2.5 Million.

As for Pending Sales, there are currently 48 homes in some Pending Sale status  in this combined area.

Current Trends: For the currently Pending Sales, the Average asking price is $308,655 and the Median price is  $265,831, but keep in mind that actual Average Selling prices have tended to be about 2.2% below the Sale Pending Price.

With only 2 recorded sales month to date, it appears the number of homes that will be recorded sales for September will almost certainly be less than the extraordinary high number of homes Sold in August and it also appears that the Average and Median selling prices will slightly decline for September.

Thank You for visiting our blog.  We hope you will bookmark it in your browser and come back often, or we invite you to Get the RSS feed

Brian Wilson, Broker;  mobile: 360-689-2466
-and-
Jana Salmans, Managing Broker;  mobile: 360-509-9684

John L. Scott Real Estate
19723 10th Ave NE; Suite 200
Poulsbo, WA 98370

jls_logo_trans_200x60

Data Source: Northwest MLS (NWMLS)
The  NWMLS, Brian Wilson or Jana Salmans do not guarantee the accuracy of this data and are not responsible for it’s accuracy.  Data from the NWMLS may not reflect all real estate activities in the market. Information deemed reliable but not guaranteed.

Posted in Port Gamble Kingston & Hansville RE data | Tagged , , , , , , , , | Leave a comment

Indianola & Suquamish Home Sales Data: June – August 2013

Graph of Indianola & Suquamish Real Estate Trends August 2013

Real Estate Home Sales, Trends & Prices Indianola & Suquamish August 2013

The number of home sales in Indianola, WA & Suquamish, WA have been in a consistent and typical range with 12 homes Sold in June and 11 homes Sold in both July & August, which is the same number as were Sold in August 2012 one year ago.

Because of the relatively small number of homes Sold monthly in this combined area, the data is dramatically affected from changes in the composition of sales.  A few more high-end sales, and the data jumps to the high range and visa-verse for lower priced sales.  There is also a dramatic impact from even a nominal change in the number of distressed sales.   As shown in the chart below, compare July and August when the number of distressed homes sold went from 5 to 3.   It doesn’t seem like much of change but 5 distressed sales comprised 45% of all homes Sold while 3 comprised only 27%.  This is a huge variation which has a dramatic affect on the data.

Mo_Data_BordersWhile this combined area has these monthly gyrations, we feel it is important to include Indianola & Suquamish as a separate combined market area for our reporting because they share many similar aspects buyers might be wanting; including commuter location,  geography and similar types of waterfront and view homes.

A current snapshot of the inventory here, reveals 52 Active listings which represents nearly 5 months of inventory at the current sales rate.   The Average asking price of $345,362 and a Median asking price of $259,700.   Five months of inventory is a bit heavy, but generally considered to be about neutral to slightly a Buyers market.

There are currently 21 homes in some form of “Pending Sale” status.  Of these, the Average Price when they went under contract was $339,061 and the Median price was $263,096.  So, these Pending Sales indicate increasing prices at least for the period when they will close.

Month to date, there is only 1 recorded Sale so far, but sales typically tend to bias toward the end of the month, so given the number pending, we may see a slight decrease in the quantity of monthly home sales, but they should still be above the number Sold in September (2012) one year ago when there were only 4 homes Sold.

Thank You for visiting our blog.  We hope you will bookmark it in your browser and come back often, or we invite you to Get the RSS feed

Brian Wilson, Broker;  mobile: 360-689-2466
-and-
Jana Salmans, Managing Broker;  mobile: 360-509-9684

John L. Scott Real Estate
19723 10th Ave NE; Suite 200
Poulsbo, WA 98370

jls_logo_trans_200x60

Data Source: Northwest MLS (NWMLS)
The  NWMLS, Brian Wilson or Jana Salmans do not guarantee the accuracy of this data and are not responsible for it’s accuracy.  Data from the NWMLS may not reflect all real estate activities in the market. Information deemed reliable but not guaranteed.


Posted in Suquamish & Indianola Real Estate, Uncategorized | Tagged , , , | Leave a comment

Kitsap County Home Sales Report for May 2013

Note: In the event you got to this article from an older link, here is a link to the newest data for this category of monthly home sales in Kitsap County
Graph of Kitsap County Home Sales and Prices for May 2013

Graph of Kitsap County Home Sales and Prices for May 2013

May was a record month for home sales in Kitsap County.  There were 320 closed sales which is a high going back more than 3 years!.. It may even be an all time record, but we expect to see it smashed again next month!

The average and median selling prices both increased in May, with the average going from approximately $269,000 to approximately $286,000 which is almost identical to the May 2012 average sold price.  The median jumped from $226,000 to about $246,000 which is 11.8% above the May 2012 Median home price.

Approximately 25% of the home sales were distressed properties which has been very consistent at about 25% of sales for the previous 6 months.  There are some interesting aspects to the distressed data.  As sales increase, the number of distressed sales has also proportionately increased, staying very solidly and stubbornly at 25% of sales.

For the month of May, the composition of the distressed sales is continuing to shift away from foreclosures and toward Short Sales with 45% being Short Sales and 55% being REO’s (bank owned foreclosures).  We will continue to watch this in the coming months to see if it is in fact a trend that continues or not.   The good news about this is that for a variety of reasons, generally Short Sales are not discounted as much as bank owned properties so this favors and supports increasing home prices.  The bad news is that there are still so many distressed properties being sold, and nobody seems to know (or will disclose) the real data as to how large this “shadow inventory” really is.  All we know, is that every month County-wide, there are between 50 – 80 distressed home sales and it seems to be an endless supply.  As the real estate market improves, distressed sales will moderate at some point, and we will certainly be watching for the signs of this.

Looking ahead, in Kitsap County there are currently 945 homes under contract as Pending  or contingent home sales which is up from 910 last month! We will once again project that sales will be at a record level exceeding the May quantity.  Our best estimate is that there will be a monumental 375 homes Sold during June!

Looking ahead at June and beyond, it appears that the median selling prices will be declining to somewhere in the mid $220K range and average prices are also coming under pressure as there are more lower priced sales and it appears the average is headed to somewhere in the mid $250K price range.  These are just estimates based upon the month-t0-date sales through June 8 (69 closed) and the pending sales data, so next month we’ll see how good our estimates are, but even with an error in our data for the quantity of home sales that could be +/- 15% we think it’s valuable to let you know the projected market trends.

Thank You for visiting our blog.  We hope you will bookmark it in your browser and come back often, or we invite you to Get the RSS feed

Brian Wilson, Broker;  mobile: 360-689-2466
-and-
Jana Salmans, Managing Broker;  mobile: 360-509-9684

John L. Scott Real Estate
19723 10th Ave NE; Suite 200
Poulsbo, WA 98370

jls_logo_trans_200x60

Posted in Kitsap County Real Estate Data | Tagged , , , , , , , | Leave a comment

Bainbridge Island Real Estate Report for May 2013

graph of Bainbridge Island May 2013 Home Sales data

Bainbridge Island May 2013 Home Sales data

{Note: If you got to this page from a search and it’s an older post, please go here to get the most recent report & data}

The number of homes Sold on Bainbridge Island during May surprised to the upside increasing from 43 in April to 47 in May.  It appears the main reason the projected slight decline in closed homes for May did not materialize was due to pending home sales closing  faster than anticipated.  Offers are being written aggressively to win seller approval against competitive offers and one of the strategies being used is to offer faster closing dates in the offers.   With well qualified buyers having pre-approvals in place and using lenders with local underwriting; loan processing and underwriting approval times are being reduced.  There are also a significant number of cash purchases closing which can have very short closing times.

As projected, the average selling price increased from approximately $547,000 in April to over $555,000 in May.  Also in line with our projections, the median selling price declined from $500,000 in April to just over $460,000 in May.

It is noteworthy to point out that on average, the list price where an offer was received by a Seller was very close to the actual average selling price.  This means that generally (on average) offers are coming in very close to or at the asking price.  This is indicative of a very competitive real estate market where there is strong demand for the available homes listed for sale.  Of course there are varying competitive pressures with various property types and price points, which is why we stress “average”

Looking ahead, it appears the real estate market on Bainbridge Island is continuing an increasing price and sales trend.  Pending home sales of all status types increased again, moving from 92 in April to 97 in May.  From the Pending sales, it appears that June will see about the same number of closed sales +/- as we had in May, so home sales remain brisk.

Due to the composition of property types that are currently Pending and waiting to close, we project that there will be a decline in June for both the median and average selling prices to approximately $450,000 and $500,000 respectively, however; looking toward July, we anticpate a strong rebound in both the Median and average prices as home sales continue a strong and increasing trend on Bainbridge Island.  

Some significant factors which support increasing home prices on Bainbridge include the supply of homes at or below the current median selling price which has dwindled to less than 29% of the available homes for sale.  We also see a declining number of distressed properties of all types including REO’s and Short Sales available for sale and there is still 20% of the available homes for sale with an asking price over $1Million.  The bias is strongly toward increasing prices and there appear to be plenty of buyers wanting the fabulous lifestyle on Bainbridge Island who are willing and able to buy homes here at all price points.

Thank You for visiting our blog at www.RealEstateSounder.com or www.mykitsaprealestate.net/wordpress.  We hope you find the data useful or at least interesting and we invite you to subscribe to
Get the RSS feed.  If you have any comments, please put them in the comment area at the bottom of this post.

Brian Wilson, Broker  cell: 360-689-2466  -and-
Jana Salmans, Managing Broker cell: 360-509-9684

jls_logo_trans_200x60

19723 10th Ave NE; Suite 200
Poulsbo, WA 98370

Posted in Bainbridge Island Real Estate Data | Tagged , , , , , , , , | Leave a comment

May 2013 Home Prices & Trends in Poulsbo

Graph of Poulsbo Real Estate Data for May 2013

Poulsbo Real Estate Data for May 2013

{Note: If you got to this page from a search and it’s an older post, please go here to get the most recent report & data}

Home sales in Poulsbo jumped from 33 in April to 39 in May, which is the second highest number of monthly home sales going back more than 3 years!

The Combined Days on Market for the sold properties had a dramatic decline during May, dropping from 179 days in April to 80 days in May. This is an indicator of how quickly properties are selling on average.  Many of the most compelling properties, those that are market ready, needing no repairs and are priced well, are receiving multiple offers within the first few days of being listed, and offers are coming in at full price with minimal contingencies.  Sellers are often having the luxury to choose the buyer they want to work with.  To be a successful buyer in this environment, you need to be pre-approved with a lender and depending upon the property, be prepared to make your best offer right from the start.

Prices were also on the rise with the average home price increasing from just over $262,000 in April to over $291,000 in May.  The Median also increased from $269,000 in April to $280,000 in May.  This is 11.8% above the median home price in May 2012.

Distressed home sales continued at the low end of the range we’ve seen and comprised just over 15% of the homes sold in May which was almost identical to the April level, however; the composition switched from being mostly Short Sales to being predominately bank owned foreclosures (REO’s).

Looking ahead, home sales are continuing to increase in Poulsbo with Pending sales rising from 114 during April to 119 during May as of the date of this report.  We project that closed sales in June will be at a new 3 year high and distressed property sales will continue at the low end of the range we’ve seen but will again shift back to being predominately Short Sales with very few bank owned foreclosures! 

Both the average and median home prices appear to be continuing on an increasing trend line and as implied, there is an increasing number of higher priced homes comprising the sales mix in the Poulsbo Real Estate Market.

Thank You for visiting our blog at www.RealEstateSounder.com or www.mykitsaprealestate.net/wordpress.  We hope you find the data useful or at least interesting and we invite you to subscribe to
Get the RSS feed.  If you have any comments, please put them in the comment area at the bottom of this post.

Brian Wilson, Broker  cell: 360-689-2466  -and-
Jana Salmans, Managing Broker cell: 360-509-9684

jls_logo_trans_200x60

19723 10th Ave NE; Suite 200
Poulsbo, WA 98370

Posted in Poulsbo Real Estate Data | Tagged , , , , | Leave a comment

May 2013 Home Sales & Trends in Indianola and Suquamish

graph of May 2013 Home Sales Data for Indianola & Suquamish

May 2013 Home Sales Data for Indianola & Suquamish

{If you were sent to this page and it happens to be an older post, you can get the most recent post for these areas here }

There were 8 homes Sold in the combined areas of Indianola and Suquamish during the Month of May which is above the 5 homes Sold during April.  Looking ahead we project that home sales will continue to increase and remain at high levels for the next couple of months.  It appears we will have about 12 homes that will be sold in June and between 8-10 in July.

The Average selling price dropped dramatically in May from approximately $295,200 during April, down to about $182,000 during May.  The Median selling price also dropped from $275,000 during April to $145,500 during May.  These large swings in prices can be expected given the small sample sizes, where small changes in the composition of the sales leads to large swings in prices.

It’s likely the biggest factor contributing to the large price swings from April to May, was the large proportion of distressed sales which comprised the May data.  During April there were 0% distressed sales, however; during May distressed sales (REO’s and Short Sales) jumped to 50% of the total sales.  Again, it is important to keep this in perspective and recognize that this 50% quantity was actually only 4 distressed home sales!

Looking at the currently Pending Sales data, it appears that distressed home sales will continue to be a significant proportion of the sales in these areas for the coming couple of months.  The composition of the distressed sales however, is shifting from foreclosures to Short Sales and there are increasing numbers of higher end homes in the mix.  These factors will contribute to increasing average and median selling prices which we estimate will jump to over $270,000 and $200,000 respectively during the month of June.

Thank You for visiting our blog at www.RealEstateSounder.com or www.mykitsaprealestate.net/wordpress.  We hope you find the data useful or at least interesting and we invite you to subscribe to

Get the RSS feed.  If you have any comments, please put them in the comment area at the bottom of this post.

Brian Wilson, Broker  cell: 360-689-2466  -and-
Jana Salmans, Managing Broker cell: 360-509-9684

jls_logo_trans_200x60

19723 10th Ave NE; Suite 200
Poulsbo, WA 98370


Posted in Suquamish & Indianola Real Estate | Tagged , , | Leave a comment

Hansville, Kingston, Port Gamble Home Sales for May 2013

Graph May 2013 Home Sales Data for Hansville, Kingston & Port Gamble

May 2013 Home Sales Data for Hansville, Kingston & Port Gamble

{Note: If you got to this page from a search and it’s an older post, please go here to get the most recent report & data}

As we predicted in last months report, the number of homes sold in the combined market area of Hansville, Kingston & Port Gamble was near a record level with 22 homes sold in May.

We also predicted the median selling price would dip from the April level of $310,000 down to about $260K and it did.  The actual median selling price for May was $256,000, so our projections were within ~98.5% of the actual results for May.

The average selling price increased from approximately $317,000 in April to about $340,000 in May.  This increase was largely due to some higher end home sales in the area, including one in Kingston that was over $1.8 Million.  Many of these homes had been on the market longer than average so the average days on market for the homes sold during in these areas during May also increased.

Distressed properties comprised 22% of the sales in these areas during May, which is up slightly form the April level of about 18%, but still at the lower end of the range we’ve seen over the past 2+ years.

Looking ahead to June, we predict that the number of sold homes will continue at near record levels, however, it appears that sales of distressed properties will be rising to about 30% of the sales in June, which will put pressure prices, so for June, we are projecting the Average selling price will dip to near $300K, and the Median will also decline to below $250K.

Thank You for visiting our blog at www.RealEstateSounder.com or www.mykitsaprealestate.net/wordpress.  We hope you find the data useful or at least interesting and we invite you to subscribe to
Get the RSS feed.  If you have any comments, please put them in the comment area at the bottom of this post.

Brian Wilson, Broker  cell: 360-689-2466  -and-
Jana Salmans, Managing Broker cell: 360-509-9684

jls_logo_trans_200x60

19723 10th Ave NE; Suite 200
Poulsbo, WA 98370

Posted in Port Gamble Kingston & Hansville RE data | Tagged , , , | Leave a comment

Waterfront Real Estate Prices, Sales, Trends in Kitsap County

Note: if this is an older post, go here to get to the latest information

This report is about all salt waterfront home sales, prices and trends in Kitsap County, WA through April 2013 and includes Bainbridge Island Waterfront, Poulsbo Waterfront, Hood Canal, Liberty Bay, Dyes Inlet and all other areas in the County.  Sales & Prices are rapidly increasing

graph of Waterfront home sales Kitsap County April 2013

Waterfront home sales Kitsap County April 2013

As we noted in our last report, waterfront home sales in Kitsap County have been rapidly increasing and are currently on track to hit new records for monthly sales in the coming months.  During March, closed sales were at about a normal seasonal rate, but Pending sales activity was beginning to catch fire and those sales are closing in May with sales activity continuing at a brisk pace.

It appears that March was a month where a lot of lower priced waterfront properties were snapped up by investors as indicated by a low median price, however; since then we have seen brisk sales at all price points with the sales trend moving toward higher priced properties, and the Median selling price increasing from a low of $384,000 in March to $410,000 in April, and the estimates for May and June are $670,000 and $597,450 respectively.   The market for waterfront properties is currently moving so quickly, we decided it is important to include our best estimates for the coming two months in this report.  Moving forward, we’ll update the report monthly to provide the actual monthly recorded sold data.*

On average, closed sales are at 95% of the price where an offer was originally mutually agreed upon.  So, while the market is rapidly improving and sales are great, there is still a normal level of negotiations occurring.

graph of Distressed Waterfront home sales compared w/all waterfront

Distressed Waterfront home sales compared w/all waterfront

There was an above average number of distressed waterfront property sales during March & April and it’s continuing through May, however; as we analyze the pending sales for June and Beyond, it appears that distressed waterfront sales will decline dramatically back to the more normal & relatively low rate compared with non-waterfront properties.


This data is intended to provide a general high level view of this market in Kitsap County, however; If you are thinking of Selling, just contact us to schedule a time we can meet and visit your home.   We’ll provide you with a comprehensive market analysis of your home including comparisons with the best comparable properties and those most similar in all ways including waterfront type and quality (Low bank compared to low bank etc..).  If you are looking to buy your dream waterfront property or make an investment, we know the market well and we’d love to talk with you too.

Thank you for visiting our blog.  We invite you to Get the RSS feed or book mark this page and visit regularly as we have a number of reports we publish regularly which can be found in the various categories in the right column on the main page.

* This data only includes Single Family Residential homes and does not include Condominiums, townhomes or mfg. homes.

Brian Wilson, Broker;  mobile: 360-689-2466
-and-
Jana Salmans, Managing Broker;  mobile: 360-509-9684

John L. Scott Real Estate
19723 10th Ave NE; Suite 200
Poulsbo, WA 98370

jls_logo_trans_200x60

Posted in Salt Waterfront Home Sales Data Kitsap | Tagged , , , , , | Leave a comment

Bainbridge Island Real Estate Report for April 2013: Sales, Prices, Trends

The real estate market on Bainbridge Island continues to be very active, with 43 homes sold during the month of April 2013, which is exactly the low-end number we predicted in March.

graph of Bainbridge Island Home Sales April 2013

Bainbridge Island Home Sales April 2013

Perhaps one of the most significant developments reflecting the strength of the market here is that the average asking price where an offer was received and accepted was above the average initial asking price for all homes sold during April!  This means on average, buyers were making offers above the asking price and there were many sellers receiving multiple offers for their homes.

The median home price for April increased 1.4% from the previous month to $500,000 which is also near the high monthly median price over the last 12 months, during which the monthly median price ranged from a low of $353,000 in January 2013 to a high of $538,500 in July of 2012.

The average selling price during April dropped from the previous month from ~ $586,000 to approximately $547,000.

Currently as of May 21, 2013 there are 170 Active listings (homes for sale) on Bainbridge Island. 

Here are some interesting facts about these Active listings:
only 7% are distressed, so distressed sales appear to be declining
over 19% of these homes for sale are priced over $1Million.
– the Median Active listing price is ~$600,000.
-The Average Active listing price is ~$862,000.

There were 7 distressed properties sold during April which is about 16% of the total homes sold which is down from 21% in March and from reviewing the current inventory of homes for sale, it appears distressed sales will be significantly declining in the coming months.

A Preview for May:
Looking at the current month-to-date data including the pending sales, we can make some predictions for the May data:
-It looks like the number of homes that will close in May will dip to about 34.
-It also appears that the Median selling price will also decline to about $475,000.
-There have been quite a few higher end sales so the average selling price appears to be increasing and we estimate it will be approximately $575,000 for the month of May 2013

There are currently 92 homes under contract in some “sale pending” status. Of this total 17 are some form of distressed sale, which is about 18% of the total future sales, a number in line with the monthly data we’ve been tracking for over 2 years.   An interesting and significant fact about these pending distressed sales is that 13 of them or about 14% of total sales are Short Sales, while only 4 or 4% are REO’s (bank owned foreclosures).  This shift toward an increasing percentage of the distressed properties being Short Sales and fewer being REO’s (foreclosures) appears to be a trend we are seeing county-wide.

Thank You for visiting our blog.  We hope you will bookmark it in your browser and come back often, or we invite you to Get the RSS feed

Brian Wilson, Broker;  mobile: 360-689-2466
-and-
Jana Salmans, Managing Broker;  mobile: 360-509-9684

John L. Scott Real Estate
19723 10th Ave NE; Suite 200
Poulsbo, WA 98370

jls_logo_trans_200x60

Posted in Bainbridge Island Real Estate Data | Tagged , , , , , , , | Leave a comment

Kitsap County Real Estate Report for April 2013; Home Sales, Prices Trends

Note: In the event you got to this article from an older link, here is a link to the newest data for this category of monthly home sales in Kitsap County

There were 285 closed home sales in Kitsap County during April 2013 which is just a few homes shy of a record number of monthly sales looking back as far as October of 2009.  In the time since then, the only month with more sales was August of 2012 with 299 homes Sold.  On average during the previous 12 months, about 250 homes were sold every month in Kitsap County.

graph of Kitsap County Home Sales Data for April 2013

Kitsap County Home Sales Data for April 2013

The median selling price for the 285 homes sold during April was $226,000 which is about 3.8% less than during the same period one year ago.  However; for some perspective, the monthly median selling price for homes sold during the previous year has varied monthly from a low of $214,500 in February 2013 to a high of $250,000 during August of 2012 with an average for the monthly median coming in at $230,400 over the previous 12 months.

The average selling price for homes sold during April 2013 was about $269,000

Another important data set is that of distressed properties.  Of the total homes sold during April, ~25% of them were distressed sales, with bank owned foreclosures (REO’s) comprising 15% and Short Sales comprising about 10%.  This is about the same rate we’ve seen recently, and about in line with the monthly percentage of distressed sales we’ve seen over the previous year.  So while some market areas like Poulsbo and Bainbridge Island are seeing declining numbers of distressed sales, county-wide the number of distressed home sales continue to be in a range from about a low of 20% to a high of over 35%.

We are noticing a significant shift in the composition of distressed properties sold in Kitsap County.  For the first time for as far back as our data goes, we are seeing Short Sales comprising a larger percentage of distressed sales than REO’s (bank owned foreclosures).  Of the month-to-date sold properties 14% are closed Short Sales and only11% are REO’s.    This is the first time there are more Short Sales than REO’s. A review of the “Pending Sales” data shows an even more impressive shift: 13% are REO’s while 23% are Short Sales!  This is almost a 100% reversal of the composition of distressed sales data going back as far as 2009!  We will certainly be watching to see if it continues.  There may be many factors involved in the apparent shift in the data, but this may finally indicate a meaningful change, with lenders making a bigger good faith effort to close short sales rather than go to foreclosure.  Wow!

So far, during the month of May through 5/20, there have been 168 closed sales and the median selling price for these closed sales has increased nearly $10,000 or just over 4% from the April median to $240,000, while the average has declined slightly to about $264,500.  Overall, home prices in Kitsap County appear to be stable but biased toward increasing and we will be tracking this data closely every month.

Some of the significant factors affecting home prices are the quantity of new home sales which generally have been priced below the average resale home price and the number of distressed home sales which have also typically been priced below market.   With some areas in the County seeing a decline in the quantity of distressed properties and with rapidly increasing new home prices, the bias moving forward appears to be toward increasing home prices.

As for current and future sales activity, there is a tsunami of home sales in Kitsap County.  Currently as of May 20, 2013 there are 910 homes under contract as Pending or Contingent home sales.  Adding the current month-t0-date sales to the resale homes that have been “Pending” prior to April 15, it appears there should be a record number of closed sales for the month of May, which we estimate will be over 350 and may surprise to the upside nearing 400 or more!

New home sales in the County comprise about 17% of the total pending backlog and distressed home sales (REO’s & Short Sales) comprise about 36%, which is at the high end of the range we’ve seen over the previous year.  Because of the long time it takes for distressed properties to close (mostly the Short Sales are the big problem), they do tend to comprise a higher proportion of the pending sales as they accumulate over a longer time while non distressed properties close much more quickly (about 45 days).  With the new construction cycle running at about 5 months and Short Sales taking anywhere from 3-6 months or more….a lot of the Pending backlog will be closing over an extended period of time.

Thank You for visiting our blog.  We hope you will bookmark it in your browser and come back often, or we invite you to Get the RSS feed

Brian Wilson, Broker;  mobile: 360-689-2466
-and-
Jana Salmans, Managing Broker;  mobile: 360-509-9684

John L. Scott Real Estate
19723 10th Ave NE; Suite 200
Poulsbo, WA 98370

jls_logo_trans_200x60

Posted in Kitsap County Real Estate Data | Tagged , , , , , , | Leave a comment