
Note: if this is an older post, go here to get to the latest information
This report is about all salt waterfront home sales, prices and trends in Kitsap County, WA through April 2013 and includes Bainbridge Island Waterfront, Poulsbo Waterfront, Hood Canal, Liberty Bay, Dyes Inlet and all other areas in the County. Sales & Prices are rapidly increasing
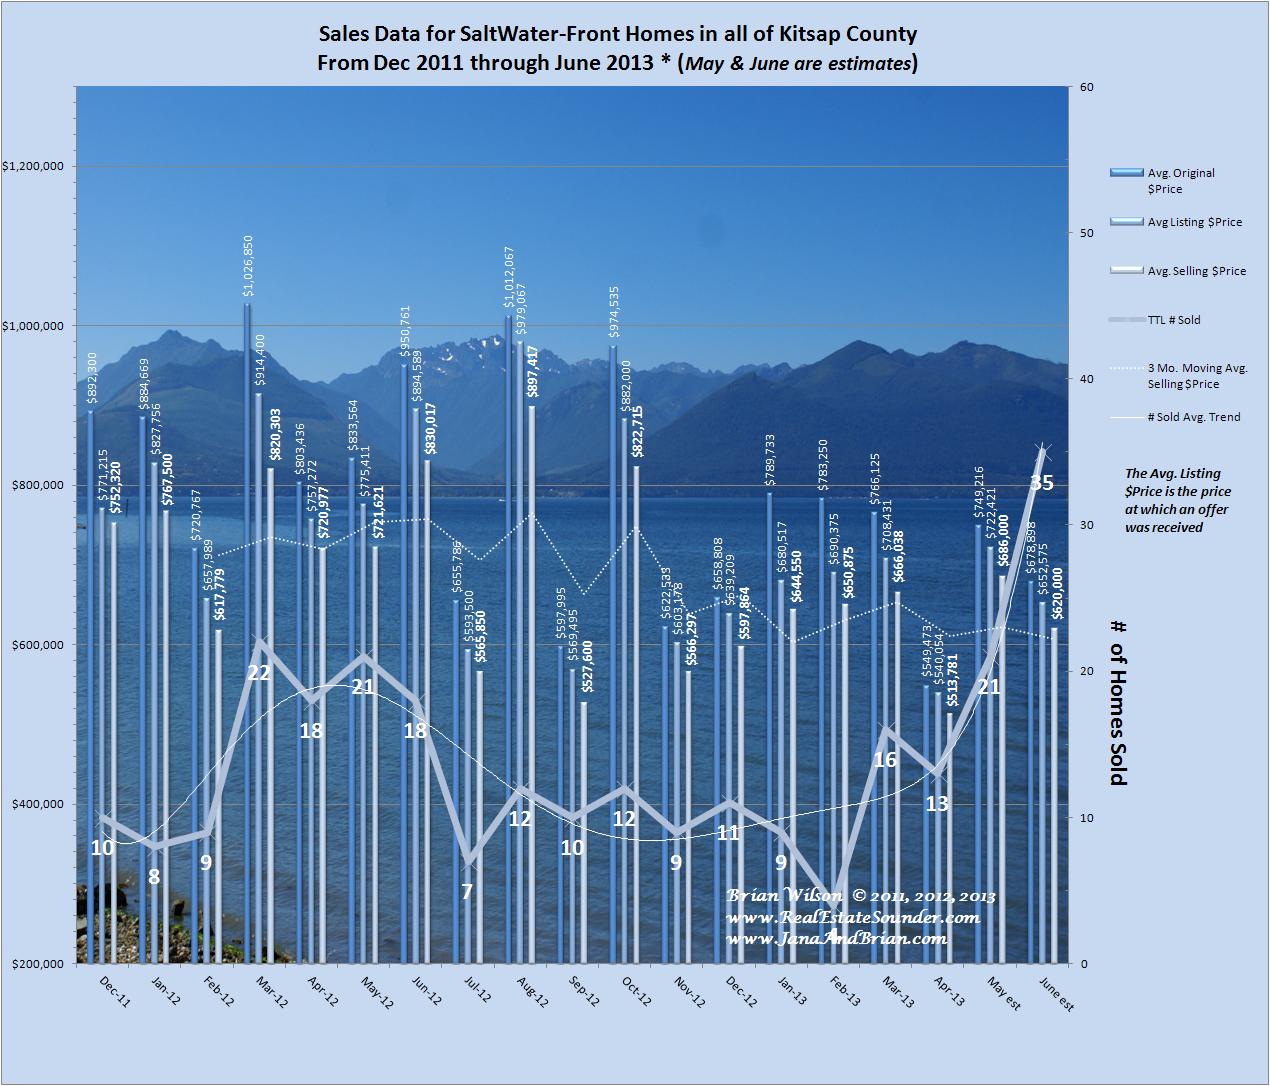
Waterfront home sales Kitsap County April 2013
As we noted in our last report, waterfront home sales in Kitsap County have been rapidly increasing and are currently on track to hit new records for monthly sales in the coming months. During March, closed sales were at about a normal seasonal rate, but Pending sales activity was beginning to catch fire and those sales are closing in May with sales activity continuing at a brisk pace.
It appears that March was a month where a lot of lower priced waterfront properties were snapped up by investors as indicated by a low median price, however; since then we have seen brisk sales at all price points with the sales trend moving toward higher priced properties, and the Median selling price increasing from a low of $384,000 in March to $410,000 in April, and the estimates for May and June are $670,000 and $597,450 respectively. The market for waterfront properties is currently moving so quickly, we decided it is important to include our best estimates for the coming two months in this report. Moving forward, we’ll update the report monthly to provide the actual monthly recorded sold data.*
On average, closed sales are at 95% of the price where an offer was originally mutually agreed upon. So, while the market is rapidly improving and sales are great, there is still a normal level of negotiations occurring.
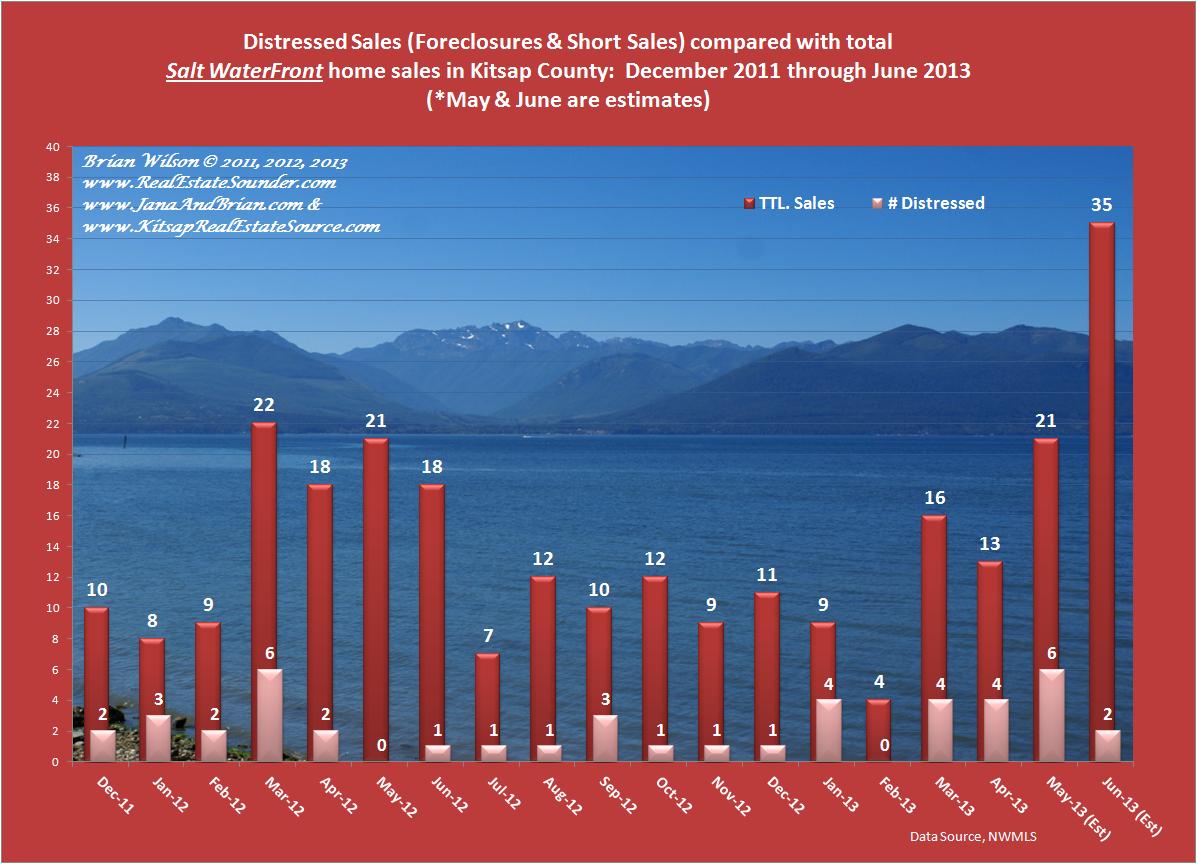
Distressed Waterfront home sales compared w/all waterfront
There was an above average number of distressed waterfront property sales during March & April and it’s continuing through May, however; as we analyze the pending sales for June and Beyond, it appears that distressed waterfront sales will decline dramatically back to the more normal & relatively low rate compared with non-waterfront properties.
This data is intended to provide a general high level view of this market in Kitsap County, however; If you are thinking of Selling, just contact us to schedule a time we can meet and visit your home. We’ll provide you with a comprehensive market analysis of your home including comparisons with the best comparable properties and those most similar in all ways including waterfront type and quality (Low bank compared to low bank etc..). If you are looking to buy your dream waterfront property or make an investment, we know the market well and we’d love to talk with you too.
Thank you for visiting our blog. We invite you to ![]() Get the RSS feed or book mark this page and visit regularly as we have a number of reports we publish regularly which can be found in the various categories in the right column on the main page.
Get the RSS feed or book mark this page and visit regularly as we have a number of reports we publish regularly which can be found in the various categories in the right column on the main page.
* This data only includes Single Family Residential homes and does not include Condominiums, townhomes or mfg. homes.
Brian Wilson, Broker; mobile: 360-689-2466
-and-
Jana Salmans, Managing Broker; mobile: 360-509-9684
John L. Scott Real Estate
19723 10th Ave NE; Suite 200
Poulsbo, WA 98370
![]()