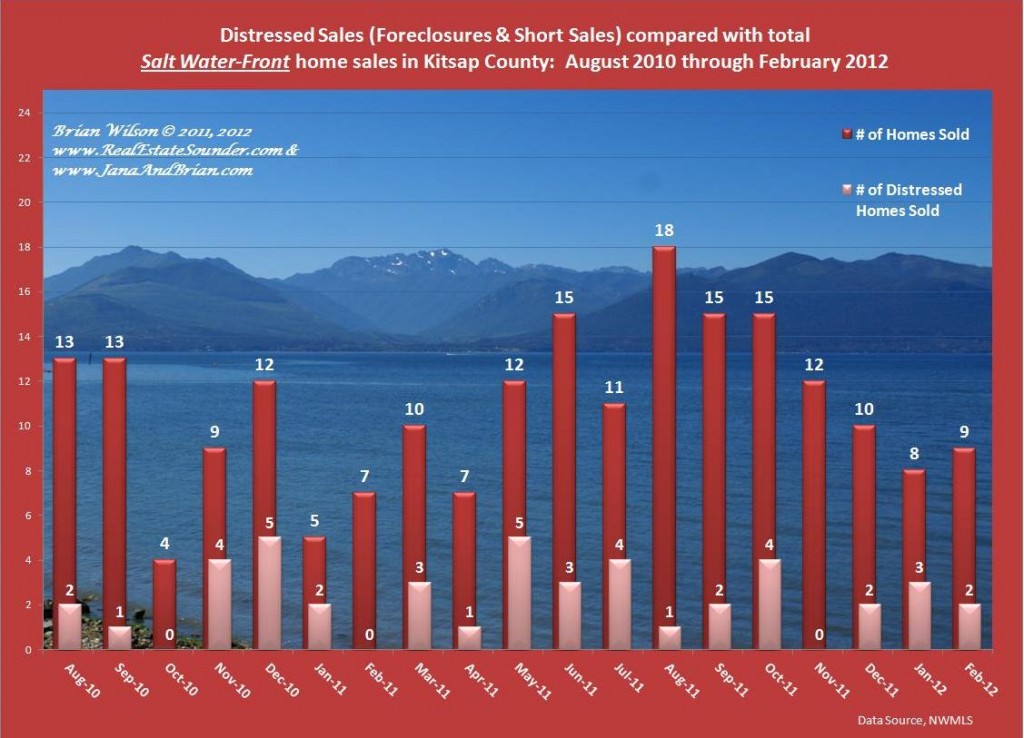
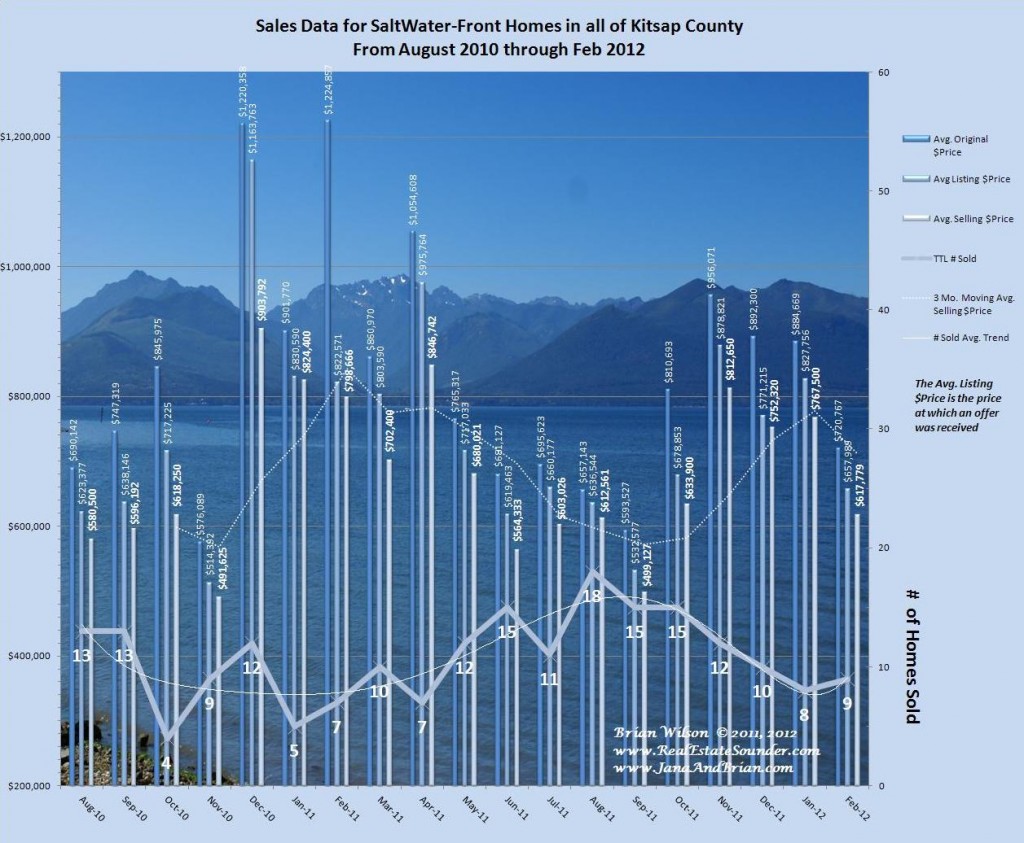
Below is a comprehensive graph showing sales, prices and trends for all of the Salt Water front homes sold in Kitsap County from August 2010 through February 2012. I am also posting the graph showing distressed properties sold compared to total monthly sales so you can easily compare all of these factors month by month.

Graph of Distressed Salt Water Front Home Sales Compared with Non Distressed Aug 2010 through February 2012
Kitsap County is an area blessed with over 230 miles of coastline that’s deeply dissected with many inlets and peninsulas. The coastline runs roughly along the West side of Puget Sound and around to the East Side of Hood Canal including many communities like Lofall, Seabeck, Stavis Bay and Holly.
Some of the major inlets and bays with fabulous waterfront properties include Liberty Bay, Dyes Inlet, Port Orchard Bay, Washington Narrows, Phinney Bay, Oyster Bay, Ostrich Bay, & Sinclair Inlet. Of course Bainbridge Island has some of the most fabulous waterfront imaginable with something to please everyone from Easterly sunrise views including views across Puget Sound to downtown Seattle, Southerly views including Puget Sound and Mt. Rainier, and Westerly views Across Port Orchard Bay including the stunning Olympic Mountains.
Some of the areas around Bainbridge Island include: Blakely Harbor, Manzanita Bay, Rolling Bay, Manitou Beach, Yeomalt Point, Eagle Harbor, Rich Passage, Blakely Harbor, Pleasant Beach, Pt. White, Fletcher Bay, Manzanita Bay, Port Madison Bay, Pt. Monroe and or course Puget Sound.
The graphs are very interesting and even a bit surprising. For the period included, they show a relatively consistent demand for these waterfront properties. We do see some major seasonal cycles: As you might expect the largest number of waterfront homes are sold between the months of July through October, with the lowest number of sales occurring during the months of December through March. Interestingly, the maximum selling prices occurred during the lowest sales months so the pricing cycle runs opposite the selling cycle. Said another way; when there are fewer homes on the market (and fewer homes selling), there are still serious buyers in the market and they pay higher average prices for the select waterfront properties that are available for sale. It appears to be a classic case of supply and demand. Buyers have the most choices and get the best deals when there are the most properties on the market, which occurs from early Summer to early Fall, however; the cycle is actually offset by about 45 days to account for the closing times.
Unlike most other real estate market segments, waterfront homes, appear to be minimally impacted by distressed property sales. Part of this is because in this market segment during the 19 month period discussed, the average monthly percentage of distressed sales compared with total sales is 22%, while the median is 20%. This is significantly lower than the general market for other categories of home sales, so distressed properties have less impact simply because there are fewer of them.
Upon closer inspection of the distressed waterfront home sales data, compared with other real estate market segments, we see there is a much higher percentage of the distressed waterfront property sales that were comprised of Short Sales.
During the 19 month period, over 40% of the distressed properties sold were Short Sales and as I have stated in other posts, Short Sales typically sell for a higher price than Bank Owned Foreclosures, so in the waterfront market, we have a double positive. There are fewer distressed properties and Short Sales comprise a much larger percentage. Therefore, the overall impact from distressed property sales is less in the waterfront home market than in all the other market segments I have been tracking.
I will have more to discuss in future posts, so I hope you subscribe to the RSS feed and visit regularly. We would like to know what you think about our blog and welcome your comments, questions or suggestions.
Thank You for visiting.
–Brian Wilson, Broker
John L. Scott Real Estate
19723 10th Ave NE; suite 200
Poulsbo, WA 98370


