This report includes new data for Salt Waterfront home sales, prices and trends, in Kitsap County from July 1 2012 through February 28, 2013 and has a total of 19 months of data. *
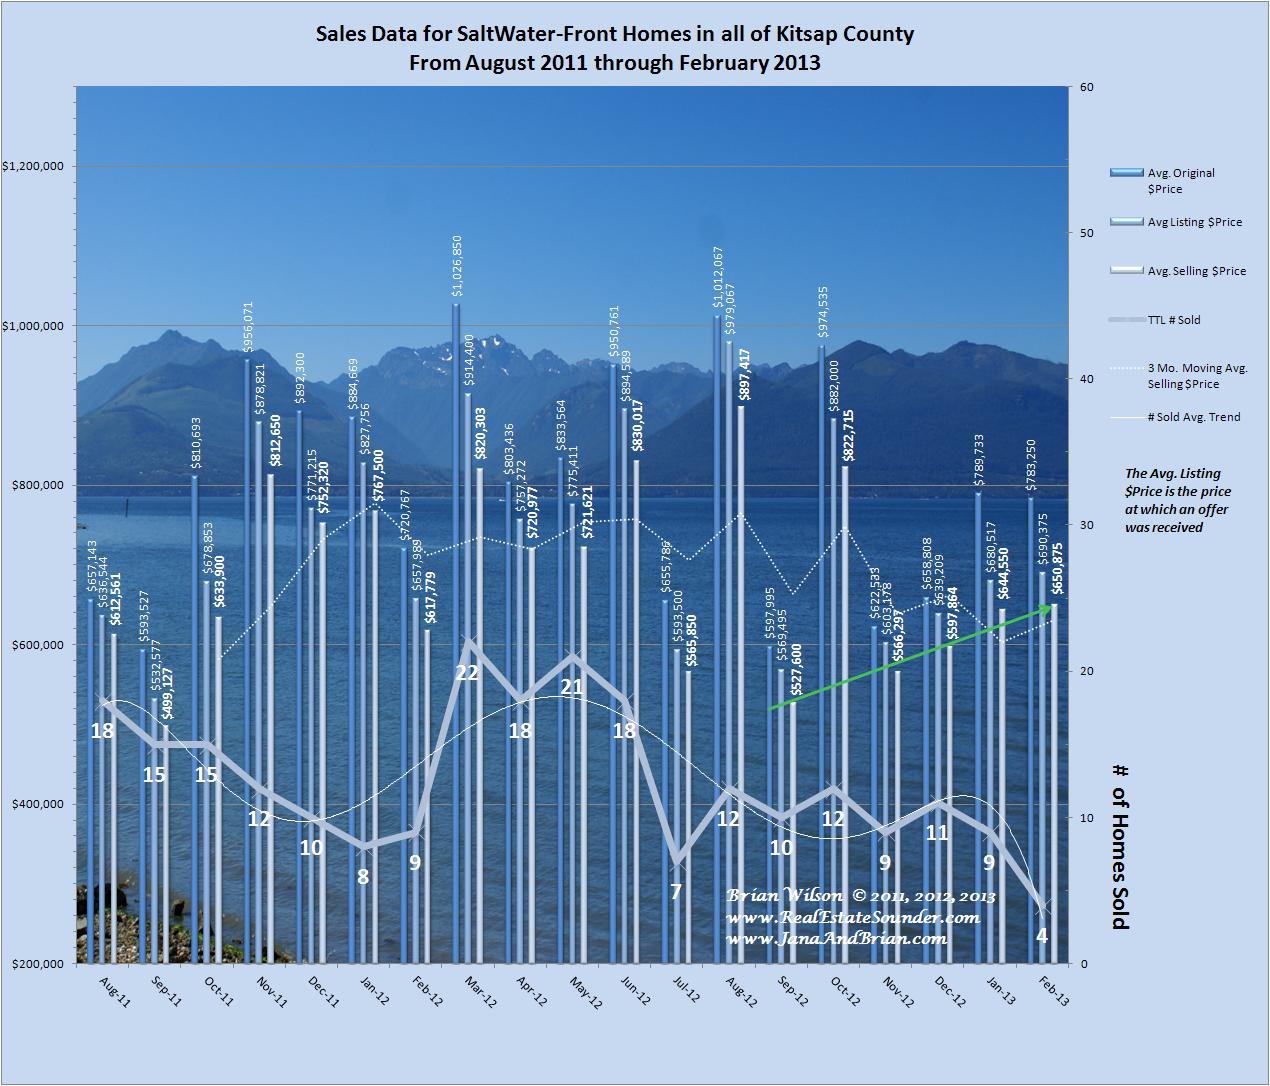
In the ensuing 8 months since my last comprehensive review of this market, there has been a slight downward trend to the number of homes sold monthly, but the Average Selling Prices have been steadily increasing over the last six months!
The median selling prices for this category of real estate have been oscillating from a high of $820,000 to a low of $412,500, but have been increasing for the last 3 consecutive months from $450,000 in December, $500,00 in January and $704,000 in February.
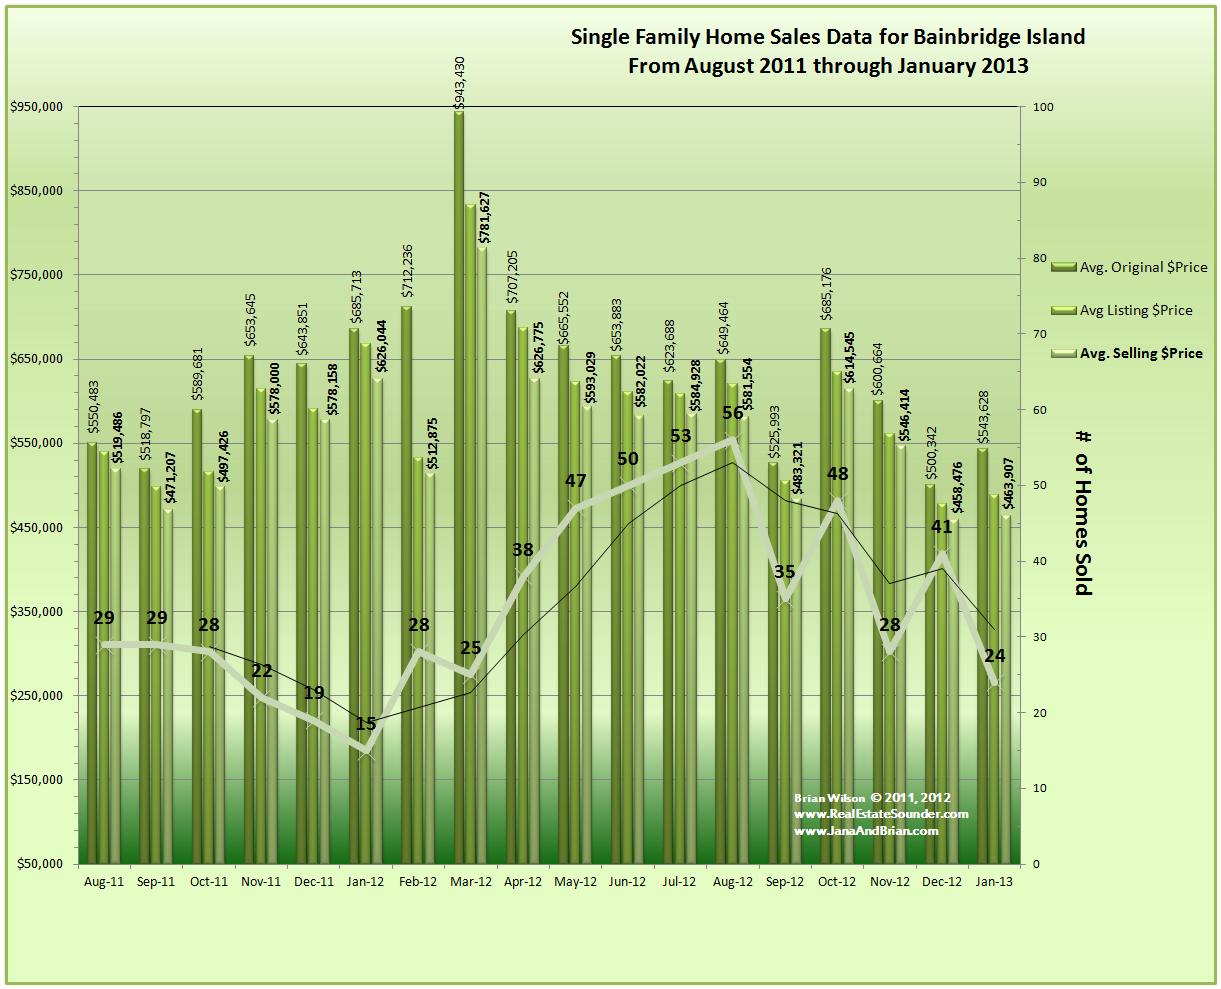
The distribution of Saltwater front sales from the various areas in the County show that Bainbridge Island as an area had the largest number of Waterfront Home Sales with 21 homes sold, however all of the rest of North Kitsap combined had 32 waterfront home sales
So North Kitsap combined, which includes Bainbridge Island had nearly 71% of the total salt waterfront home sales!
Here’s the breakdown:
Bainbridge Island: 21
Poulsbo: 9
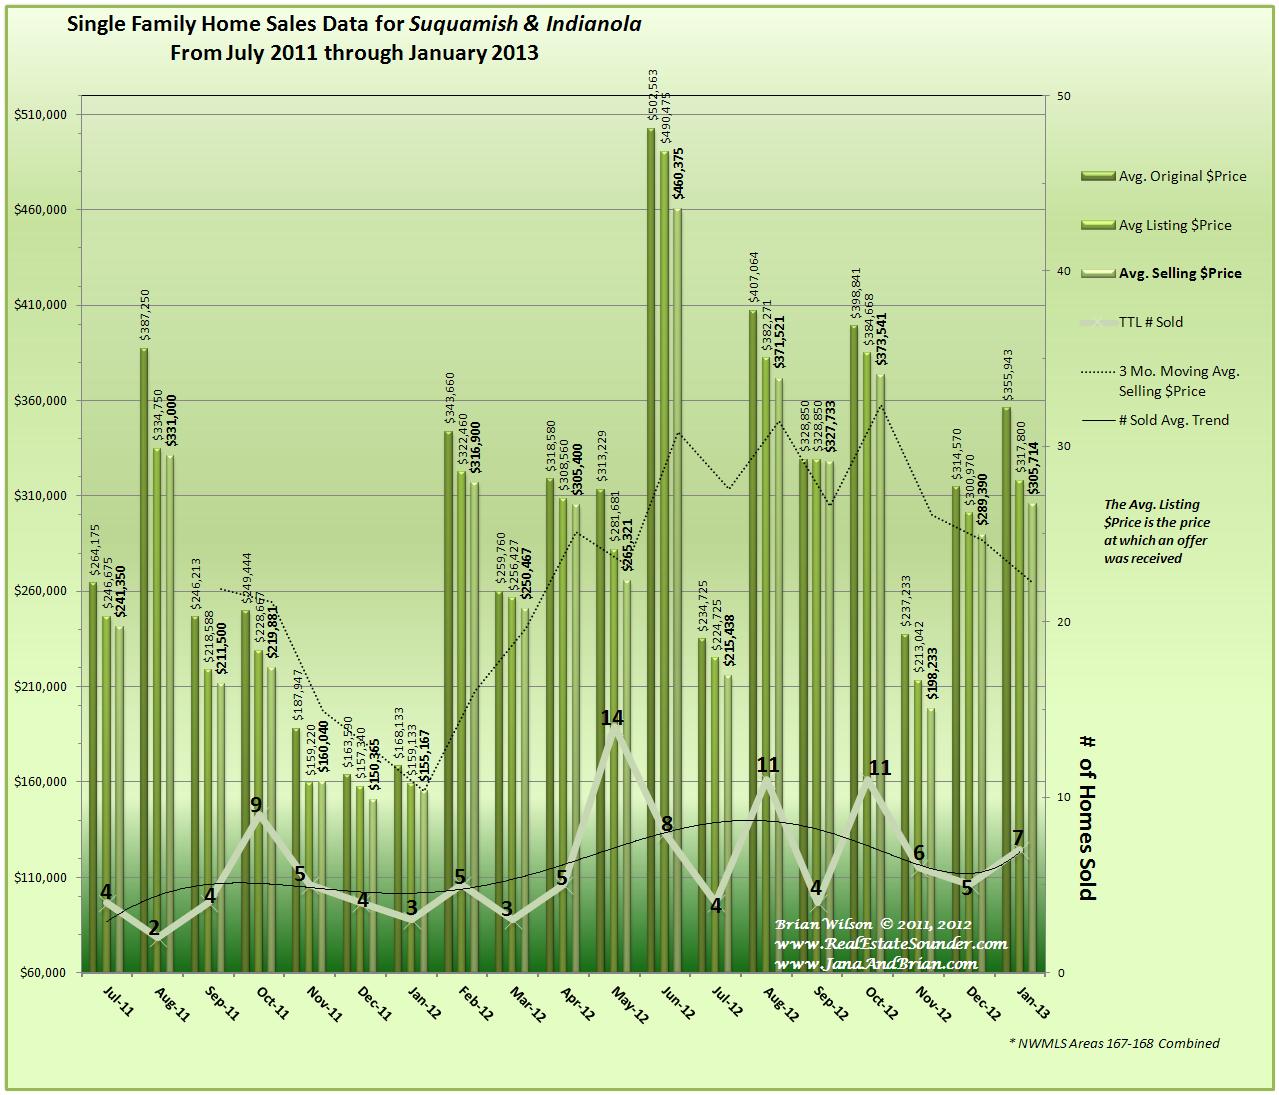
Indianola & Suquamish: 8
Kingston: 6
Seabeck: 5
Hansville: 3
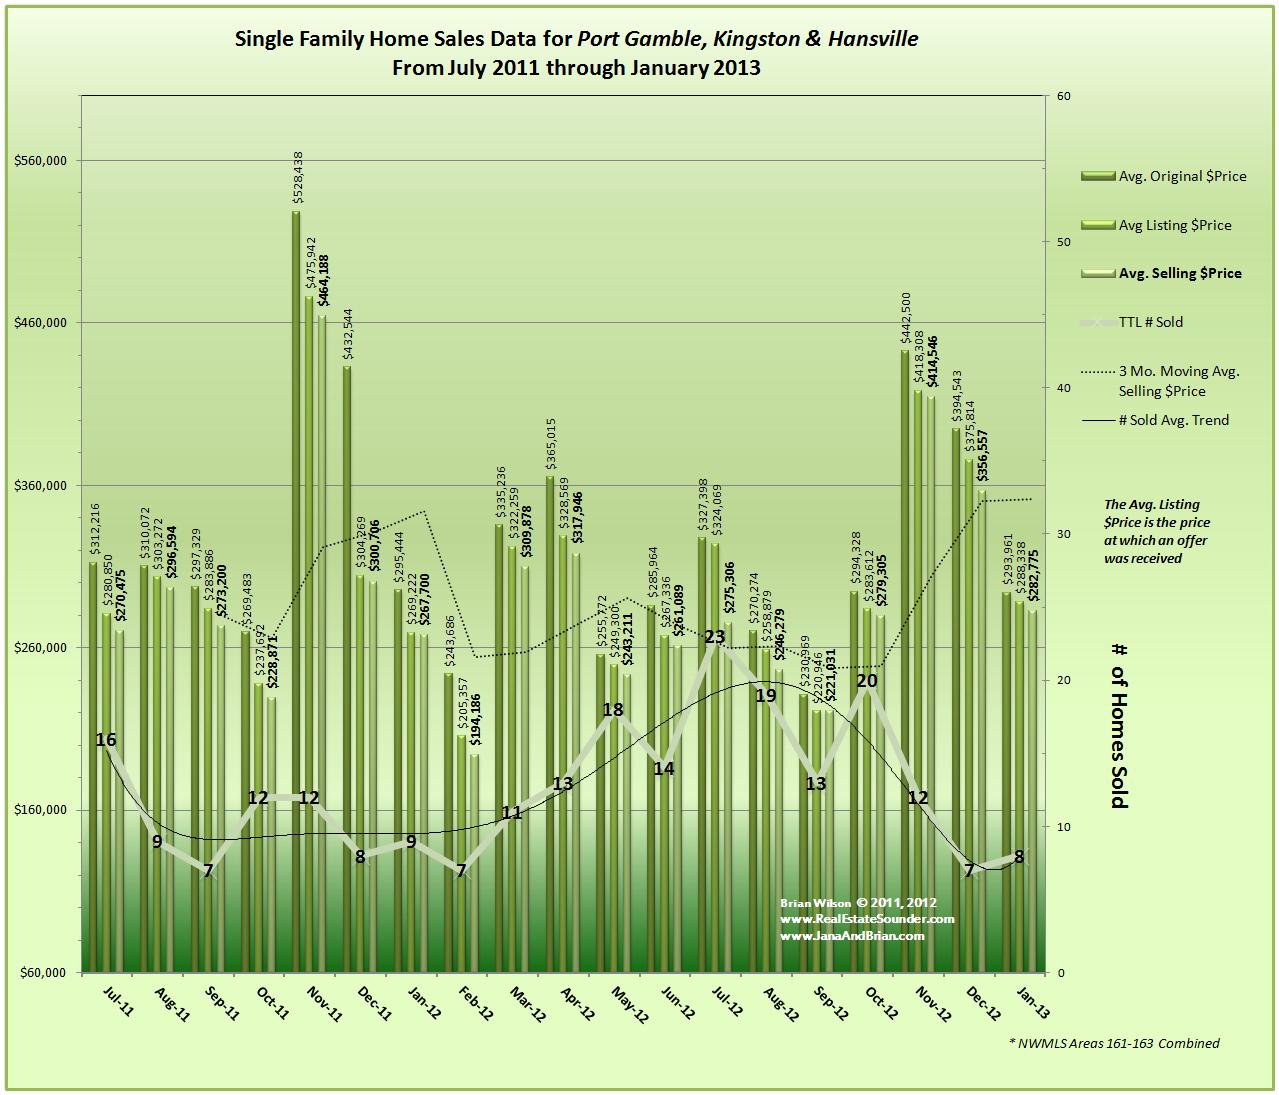
Port Gamble: 1
Silverdale: 1
Bremerton: 15
Port Orchard, Manchester, Olalla: 6
We believe the increasing trend in the average selling prices for the last 6 months, combined with an increasing median selling price over the last 3 months, (during the slowest seasonal time of the year for Real Estate), indicates an underlying demand for homes in the Salt Waterfront home market and points to further increases in the coming Spring and Summer months. It is however the case, even more-so than in other markets, that buyers for salt waterfront homes generally have time to watch and select the most compelling properties offering the amenities the buyers are looking to have. So proper positioning is crucial to getting these properties Sold & achieving the desired results for the Sellers. Our team has the expertise and comprehensive marketing power to work with our Seller clients to achieve their objectives in getting their waterfront homes Sold.
Looking forward: Another positive indicator supporting our generally positive view for this market segment is the number of currently “Pending” & “Contingent” waterfront home sales, which are currently at 29 properties! (36 if condominiums and townhomes are included) & most of these are expected to close within the next 2 months and meanwhile more sales will be added to the list.
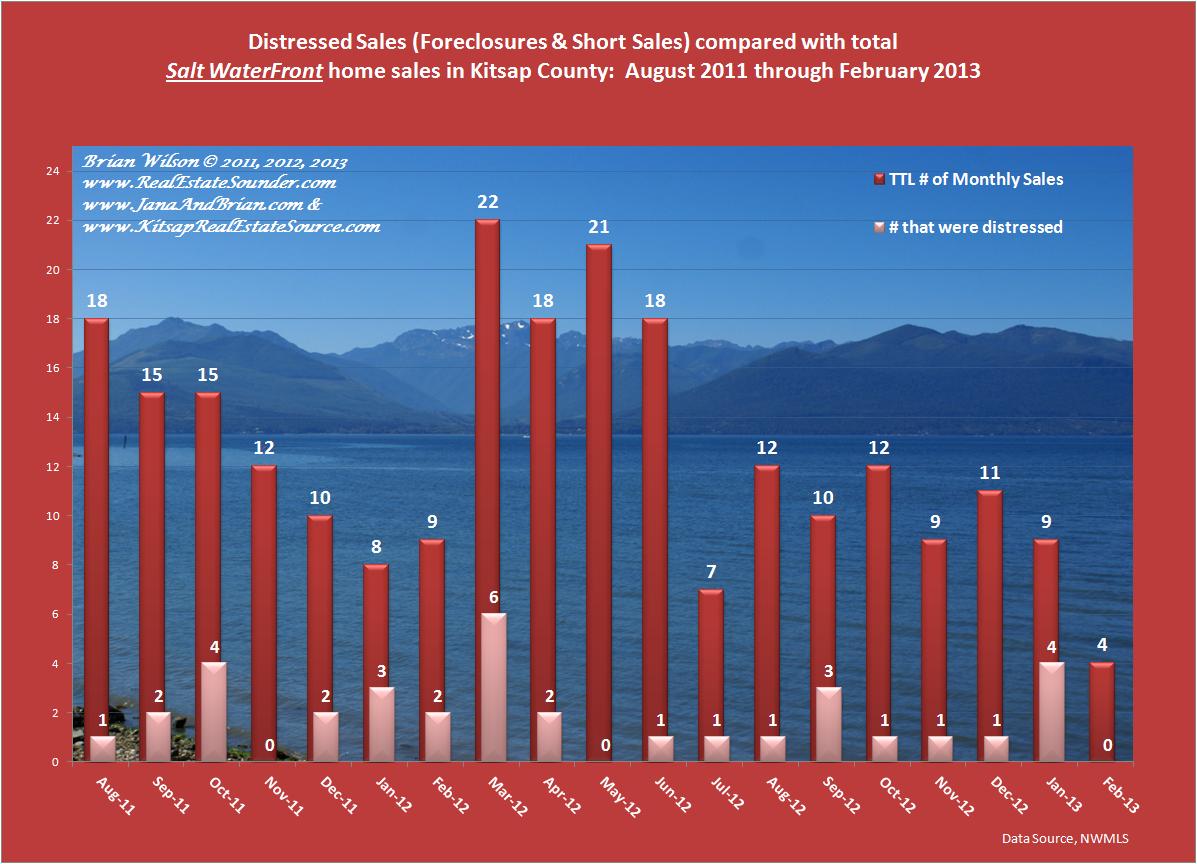
 This market segment (Salt Waterfront homes) generally continues to have a significantly reduced percentage of distressed sales compared with all other single family residential categories, however; during the past 8 months, there were two months, September & January, which had spikes in the percentage of distressed sales. Looking at the graph, there has been a pattern of these spikes in distressed sales about every 4 – 5 months.
This data is intended to provide a general high level view of this market in Kitsap County, however; If you are thinking of Selling, just contact us to schedule a time we can meet and visit your home. We’ll provide you with a comprehensive market analysis of your home including comparisons with the best comparable properties and those most similar in all ways including waterfront type and quality (Low bank compared to low bank etc..)
Thank you for visiting our blog. We invite you to subscribe to the RSS feed or book mark it and visit regularly as we have a number of reports we publish regularly and can be found in the various categories in the right column on the main page.
It is also interesting to note that virtually all of the sales for waterfront condominiums or townhomes came from either Bainbridge Island (5), or Bremerton (14) and Port Orchard with only (1). Looking forward, we expect to see the number of these sales in Bremerton to decline to a more normalized level, as many of them came from the new condominium project at Harbor Square which is almost sold out.
* This data only includes Single Family Residential homes and does not include Condominiums, townhomes or mfg. homes. If these categories of homes were included, (20 units) the total number of waterfront home sales would increase from 75 to 95.
Brian Wilson, Broker -and-
Jana Salmans, Managing Broker

19723 10th Ave NE; Suite 200
Poulsbo, WA 98370