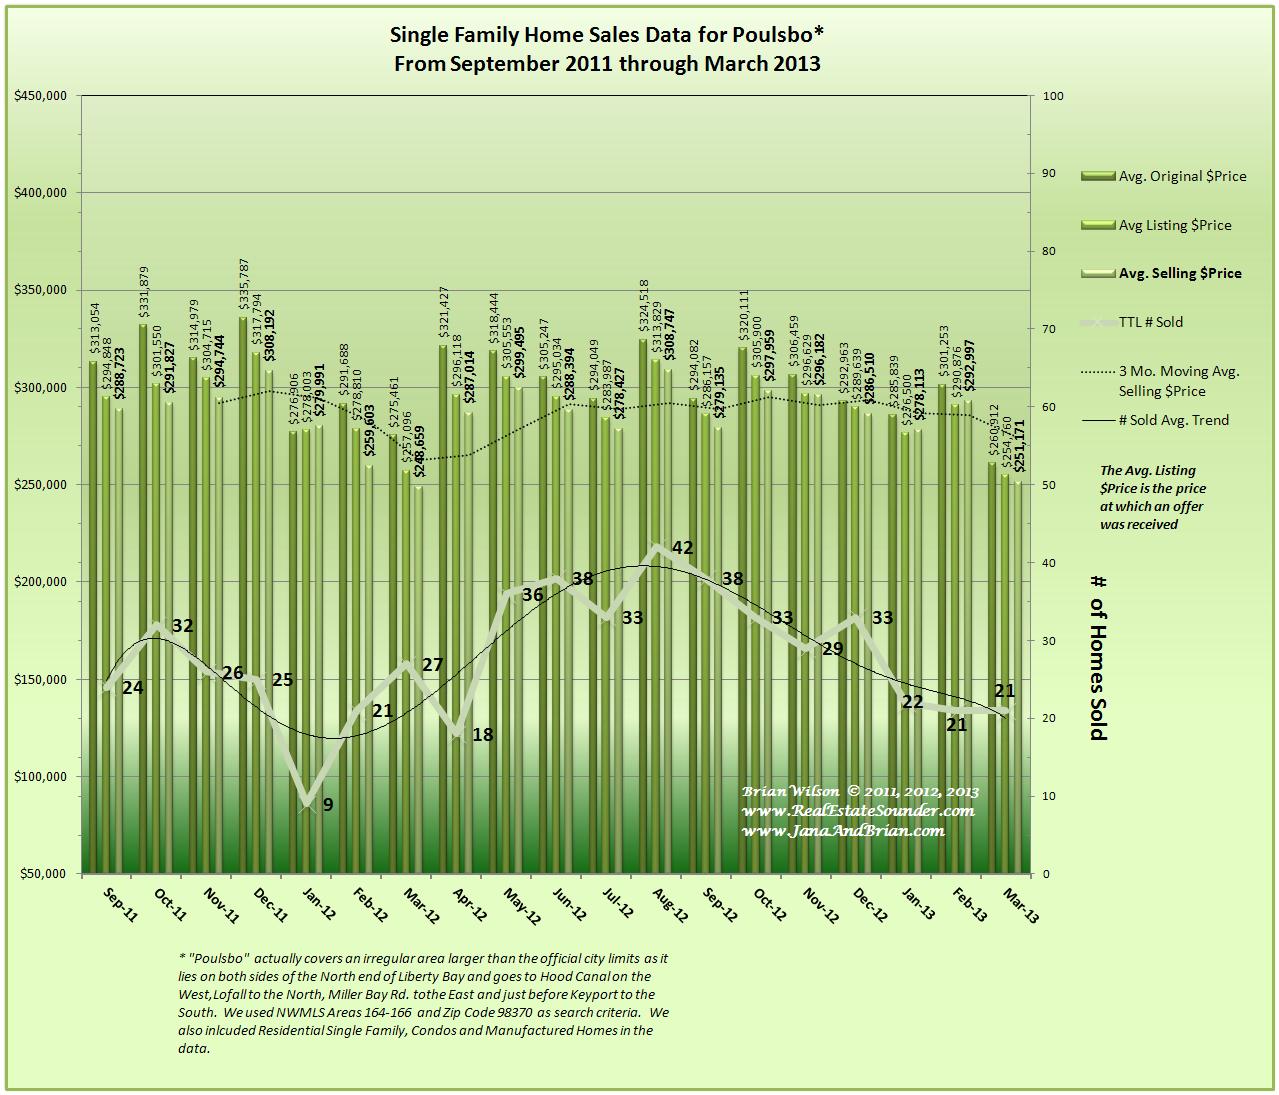
There were 33 homes sold in Poulsbo during the month of April 2013 which is a 57% gain from the previous 3 month average, but about in line with the sales we typically see in the late Spring and Summer in Poulsbo.
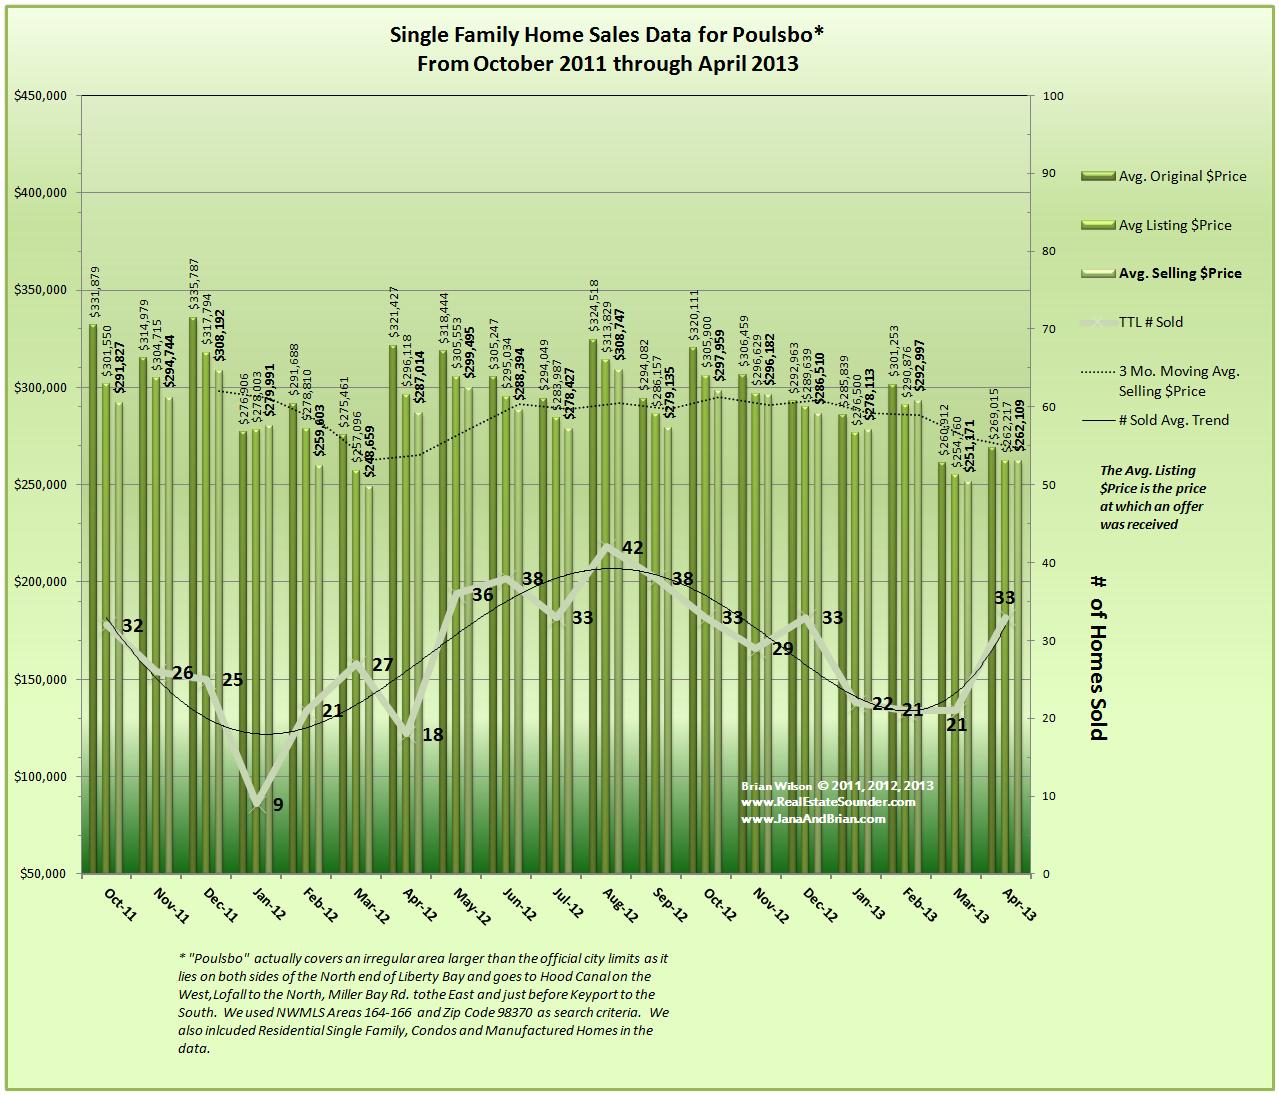
Poulsbo home sales data for April 2013
Both the median and average home prices increased from the previous month, with the median going from $230,000 to $269,000 and the average moving from about $251,000 to approximately $262,000, however; home prices in Poulsbo are still below the prices seen at this time last year and about 5.45% below average median price over the previous year.
Looking ahead at the data for May, sales are happening at a brisk pace and increasing. There are currently 114 homes in all “pending sales” categories with 33 of these being new construction, which have about a 5 month closing cycle. It appears the number of homes that will be sold during May will rise to near record levels and continue at this high level at least through July.
Distressed home sales currently appear to be declining in Poulsbo as they represent less than 16% of the total number of “Pending Sales”. Short Sales represent about 10% of the backlog of “pending home sales” while bank owned foreclosures (REO’s) are only about 6% of the total pending home sales.
The median selling price for the sales that have closed thru 5/20 is $272,000 and the average is $277,500, so the trend for prices is increasing in synch with an increasing number of resale home sales.
Thank You for visiting our blog. We hope you will bookmark it in your browser and come back often, or we invite you to ![]() Get the RSS feed
Get the RSS feed
Brian Wilson, Broker; mobile: 360-689-2466
-and-
Jana Salmans, Managing Broker; mobile: 360-509-9684
John L. Scott Real Estate
19723 10th Ave NE; Suite 200
Poulsbo, WA 98370
![]()