
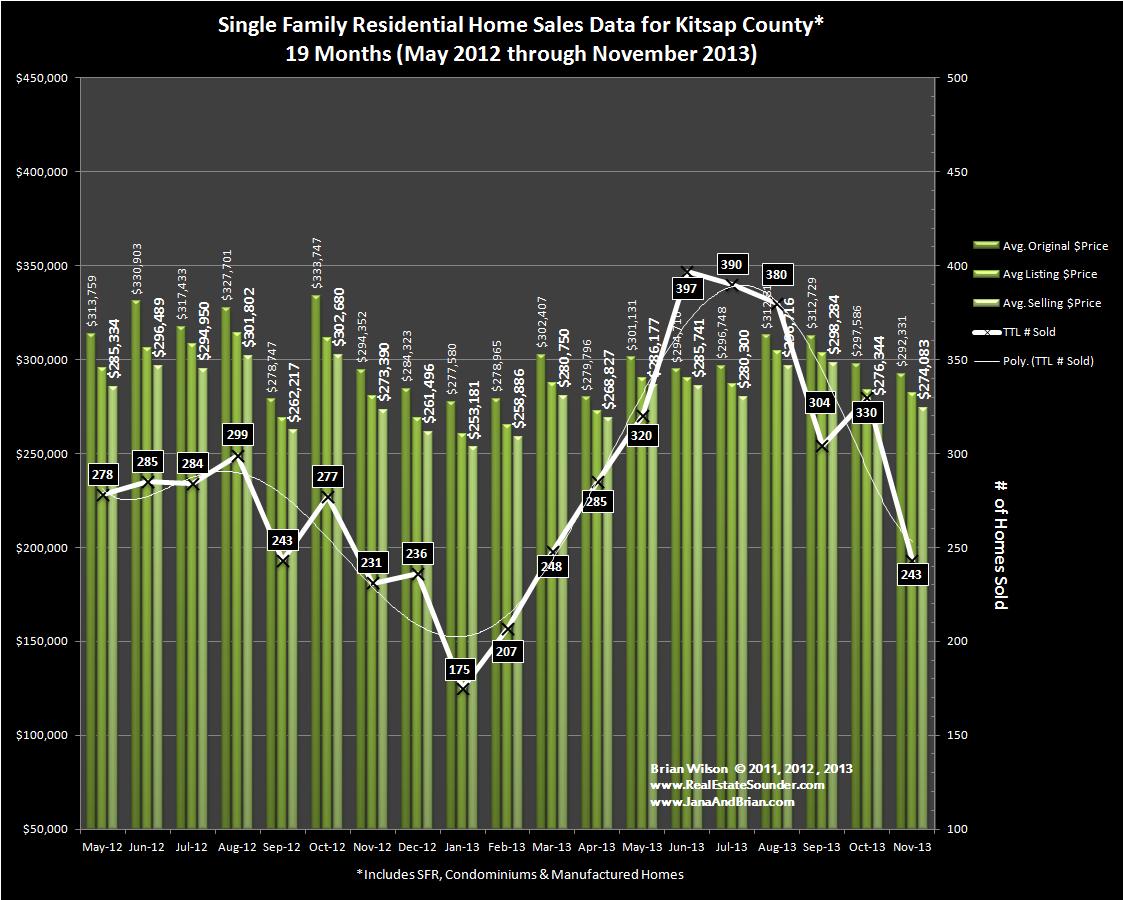
Kitsap County Home Sales Moderate from record breaking streak , returning to a seasonalized normal with 243 home sales during November 2013.
Kitsap County Home Sales stayed strong during October 2013, with 330 homes sold. This is an increase from the 304 homes sold in September, and far above last the 243 during the same month last year. The county remained on it’s record breaking streak from May through October, but returned to a more seasonally normalized level with 243 homes sold during November 2013.
October’s average selling price of $276,334 is a slight decrease from September and identical to August’s level. The median selling price was $230,000 in October and $244,400 in September. Homes sold in September were on the market a relatively short average time of 85 days. This continues the trend of the relatively low Combined Days On Market (CDOM’s) we saw in June, July & August. With the trend of increasing sales and decreasing inventory, we expect the CDOM to resume a decreasing trend with the early Spring market beginning in February.
The average selling price in November at $274,083 was similar to the Average Selling price in October. With decreasing inventory and increasing demand, sellers recently have been getting their homes sold for prices much closer to their original asking prices than we’ve seen in the last year and prior. It is trending toward being a Sellers Market, so it’s a great time to sell your home in Kitsap!
Distressed properties accounted for 20% of homes sold in Kitsap during September, 24% in October, & 26% in November. Two-thirds of these were bank re-owned properties, while the rest were short sales. These are typical percentages for the County, as distressed property sales have ranged from 18-28% over the past year. With relatively consistent quantities of distressed homes being placed on the market by banks, and with decreasing total monthly home sales, we expect to see distressed properties comprising and increasing share of sales through the winter months.
Thanks for visiting our Blog. Be sure to sign up to our RSS feed to receive the newest data and trends for Kitsap County and our other reports! As usual, we welcome any further questions you may have.
| September 2013 | October 2013 | November 2013 | |
| Avg. Original $ | $312,729 | $297,586 | $292,331 |
| Avg. Listing $ | $303,216 | $283,533 | $282,028 |
| Avg. Selling $ | $298,284 | $276,344 | $274,083 |
| Median Selling $ | $244,400 | $230,000 | $220,000 |
| TTL # sold | 304 | 330 | 243 |
| CDOM | 90 | 85 | 95 |
| DOM | 70 | 74 | 73 |
| TTL # Distressed/% | 60 /20% | 78/24% | 62/26% |
| SS | 21 | 24 | 15 |
| REO | 39 | 54 | 46 |
Brian Wilson, Broker; mobile: 360-689-2466
-and-
Jana Salmans, Managing Broker; mobile: 360-509-9684
John L. Scott Real Estate
19723 10th Ave NE; Suite 200
Poulsbo, WA 98370
![]()
Report by Briana Wilson, reviewed by Brian Wilson
Data Source: Northwest MLS (NWMLS)
The NWMLS, Brian Wilson or Jana Salmans do not guarantee the accuracy of this data and are not responsible for it’s accuracy. Data from the NWMLS may not reflect all real estate activities in the market. Information deemed reliable but not guaranteed.