{Note: In the event you got to this article from an older link, here is a link to the newest data for this category of monthly home sales in Kitsap County}
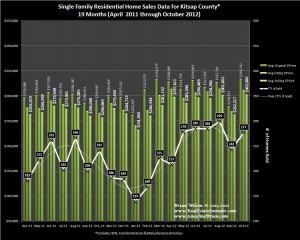
October was a good month for home sales in Kitsap County, with a strong rebound in the number of homes sold and prices compared with the September 2012 data. Kitsap County and most market areas in the County are having a strong Fall Real Estate market.
County-wide, all of the data was up. The average selling price jumped from just over $262,000 to nearly $303,000, an increase of over 15%! The total number of homes sold, jumped from 243 to 277 which is a 14% increase. The median selling price for a home in Kitsap County during the month of October increased $7,000 from $222,950 to $229,950 a gain of nearly 3%.
Distressed property sales remained at nearly at the same level during October compared with September, coming in at just over 19% of the total number of homes Sold.
We expect to see similar results during the first half of November before we arrive at our traditionally slower Winter months from Thanksgiving Through about the Middle of February.
Thank You for Visting our Blog.
Brian Wilson, Broker &
Jana Salmans, Managing Broker
19723 10th Ave NE; Suite 200
Poulsbo, WA 98370


