
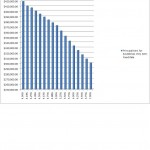
There are many ways to look at it, but the end result is the same: As rates go up, as a Borrower you qualify to Buy increasingly less home for the same amount of monthly payment.
-
Recent Posts
Categories
- Bainbridge Island Real Estate Data
- Financial Data
- Interest Rates & Graphs
- Kitsap County Real Estate Data
- National Real Estate News
- Port Gamble Kingston & Hansville RE data
- Poulsbo Real Estate Data
- Salt Waterfront Home Sales Data Kitsap
- Suquamish & Indianola Real Estate
- Uncategorized
- Washington State Real Estate Data
Archives
- March 2015
- March 2014
- February 2014
- January 2014
- December 2013
- September 2013
- June 2013
- May 2013
- April 2013
- March 2013
- February 2013
- January 2013
- December 2012
- November 2012
- October 2012
- September 2012
- August 2012
- July 2012
- June 2012
- May 2012
- April 2012
- March 2012
- February 2012
- January 2012
- December 2011
- November 2011
- October 2011
- September 2011
- August 2011
- July 2011
- June 2011
- May 2011
- April 2011
- March 2011
Get The RSS Feed